

Originally posted on Variance Hammer
A few days ago, Bell of Lost Souls published an article with the following title: Anatomy of a 40K Disaster: USA vs Europe ETC Analysis.
My first though reading the title was “Oh my god, what happened to the poor Americans?” Actually reading the article, we find out the answer is: nothing, nothing at all. The fundamental assumption of the article is that the USA’s showing in the ETC (finishing 9th in a field of 28) is some sort of unmitigated fiasco that says all kinds of important things about the state of tournament play in the United States.
In truth, it doesn’t say anything of the sort. Nor is Team USA’s performance anything even close to a “disaster”.
This article, like many that are written about international contests like the Olympics, begins with the implied assertion that the USA is somehow favored to win. Perhaps it’s because I grew up watching World Cup Ski Racing in an era where this was absolutely not true, but it always irks me when “The USA didn’t dominate the field” is immediately recast as something having gone horribly, horribly wrong.
Let me get this out of my system right now: Even if their placement was entirely their fault and did say something about how American tournament players play 40K, being among the top 1/3rd of all competitive 40K players in the world is kind of a big deal.
The author goes on to make some really sweeping and badly supported assertions about how the the Continental vs. American tournament players “play”. Americans, apparently, love them some cheese, while the Europeans manage a sublime virtuousness of being tactically flexible, maintaining the background of the game, and being in all ways Just and Good.
As evidence of this, he points to a European list with three Dreadknights, Draigo, Tigurius, and a Centurion squad. That list is many things, but some sort of zen-perfect 40K list that an American would never ever come up with is not among them.
There is also the question of what happened to the 2/3rds of teams the Americans did beat. How did their Euro-Zen builds get defeated by our blind and inept fumbling? Some commenters claim that the difference is that the Americans rely on MathHammer and theory exercises while the the Europeans actually play games, and this is clearly the difference. I have three thoughts on that:
- [Citation Needed]
- Small N simulation (what the Europeans are allegedly doing via gameplay) vs. deterministic, “On average I should…” MathHammer are both the wrong way to look at 40K as a system (in my humble opinion), so arguing about which wrong approach your using gets a little silly. What you should be doing is Large N simulations informed by play experience instead, but this is admittedly a very biased perspective.
- Again, Team USA beat the majority of the field. Where are you played games now, most of Europe?
So – if this doesn’t actually suggest that Europeans are endowed with some sort of ancient list-building arts, presumably passed down to them before 1776, nor that they totally just play more games than those lazy Americans, what do these results say?
That random systems are random. Or, for the more technical: Stochastic systems are stochastic.
Team USA’s tournament trajectory went like this: A strong series of opening games, a key loss to an opponent in a highly influential game, and then a middling-good final placement. If we view this as but one of a single sample of an infinite number of potential ETC 2015 tournaments held in some sort of hellish wargamer version of Groundhog Day, we find that this isn’t a particularly unlikely result. Indeed, in a balanced tournament scene where most teams have a ~50% chance of winning each matchup, this is an extremely likely outcome. To have done otherwise is exceptional (well played Germany, btw). If I flip a coin 6 times, and don’t get all heads, this does not mean I’m terrible at flipping coins. Nor, if I get 6 heads, does this mean that I am some sort of Ninja Coin Flipping Master.
So lets actually simulate those other possible tournaments. I’m going to do this in a slightly odd way, because I don’t actually want to fully simulate the ETC. I’ve thought about how I would do it, and it falls under the heading of “Maybe someday when I have an abundance of free time”. Instead, we’re going to treat Team USA’s result as a single draw of the round-by-round tournament results, and then use a procedure known as bootstrapping to simulate other random results that could have happened. This is somewhat handy for a number of reasons:
- It uses only the data from the ETC, so inherently the simulation cannot produce impossible results.
- This data is inherently balanced. Rather than having to simulate winners and losers, and the margins by which they win and lose, we can simply pull these from the data.
- All the ETC team’s trajectories can be reproduced using this particular system. The simulation that grabs all of Germany’s results? That’s the Germans.
- It’s way, way faster to code.
This does have some drawbacks to it – you can’t simulate things outside what happened, so someone having a streak of games better than anyone actually did at the tournament is impossible in this particular simulation. It’s not ultra-high fidelity, so you can’t do things like put in particular players with individual win percentages, etc. Maybe someday – support our Patreon drive if you want things like that to occur.
Anyway, onto the simulation.
First, lets look at the data we’re drawing from:
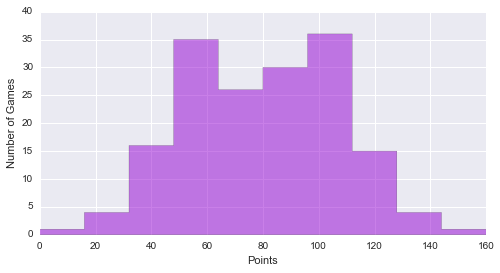
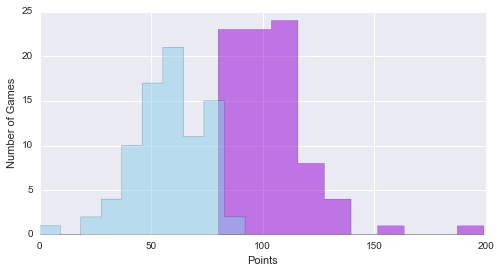
There’s a clear bimodal-ness to the distribution, which is what’s to be expected – the winners are scoring ~100 points, while the losers for each round score ~60, with both extremely good rounds and extremely bad rounds as unusual but not impossible outcomes. Broken down by Wins (Purple) vs. Losses (Blue), the distribution looks like this:
Now, let’s sample from that distribution to get a bunch of simulated team outcomes:
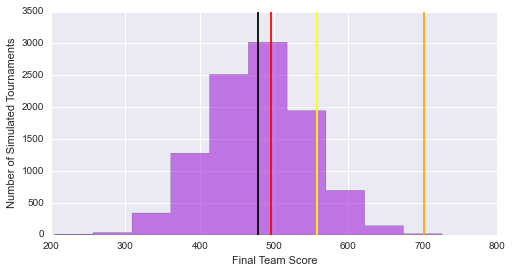
The purple histogram is the distribution of those 10,000 draws – essentially, reaching into the round results for the ETC and picking six out of the hat for their results. The black line is the mean score of 478.79. The red line the American result, the yellow line the Swedish result (the team we played to determine who got 2nd) and the orange line the German result that won the tournament.
The conclusions we can draw from this? First, again, well done Germany. That performance really is impressive. Now whether or not its possible to do better than the Germans is again something this simulation can’t touch on because the truly profoundly good games that were better than anyone actually did don’t arise in this simulation, but it is possible to draw the best points result from each round, and even then, you’re not doing much better than the Germans did (the maximum result in the simulation was 722, only 21 points better than the Germans actually did).
The second is that Team USA both performed better than average assuming the tournament scene is balanced, and despite placing in the middle of the pack, when they went in against Sweden, they really were playing for 2nd place. The difference between Team USA and Team Sweden was 62 points – so if we swapped that single result around, the Americans and the Swedes essentially swap places.
The third is the importance of defensive play and going for all the points you can every game. Unlike a tournament where results are determined simply by “Team X wins and advances to the next round” ala March Madness or any bracket-based system, or scoring systems where a loss is catastrophic in terms of earning points, mitigating the impact of losing by avoiding those particular dire loss results is a potentially important strategy. While it won’t win you the tournament, making sure your losses are hard-fought, close matches is a good way for a team to scoop up a decent showing while the teams contending for first place hopefully savage each other. For example, lets compare Team Wales (which went 3-3 and was, entering round for, 2-2 compared to the undefeated Team USA) with Team USA.
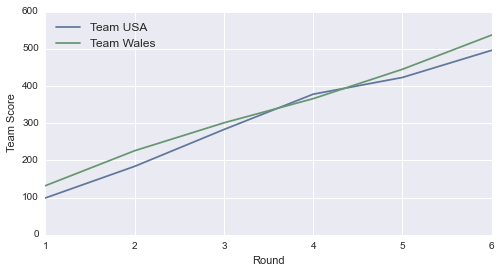
Despite Team USA’s better record, the combination of an early, big win for Wales, combined with a series of less serious losses (an average loss score of 73 vs. 59) meant they were never really “behind” the USA by a meaningful amount, even when they lost to Team USA in the 4th Round, and were thus able to secure a 4th place finish overall.
Enjoy what you read? Enjoyed that it was ad free? Both of those things are courtesy of our generous Patreon supporters. If you’d like more quantitatively driven thoughts on 40K and miniatures wargaming, and a hand in deciding what we cover, please consider joining them.